

Introduction
If you run more than one PG, the busiest building isn’t always the most profitable. Full beds can hide high electricity bills, heavy repairs, late rent, or a costly lease. Measuring PG property profitability means looking at what each building keeps after expenses, not just what it collects.
This guide explains how to calculate each property’s profit, which metrics matter, and how to rank your buildings fairly. You will also see a worked example and learn what to do with your weakest performer. Keeping records in PG and hostel management software makes this easier, but the method works with any organised records.
What Is PG Property Profitability?
PG property profitability is the money a property earns after all its operating costs, measured over a fixed period and compared with its size. In practice, you calculate net profit, net profit per bed, and profit margin for each building, then rank them.
Total rent collected is only the starting point. A property is profitable only if the rent collected is higher than everything spent to run it. Comparing per-bed figures lets you judge a 20-bed PG and a 60-bed PG fairly.
Step 1: Gather Clean Data for Each Property
Ranking your properties is only as reliable as the data behind it. For each building, collect the same information for the same month or quarter.
Income to record
- Rent actually collected (cash and UPI)
- Fines and other earned charges, if you charge them
- Any mess or food charges, if applicable
Keep refundable security deposits out of income. Counting them makes a property look more profitable than it is.
Expenses to record
Track every cost against the property that caused it:
- Rent or lease paid to the building owner (if you do not own it)
- Electricity, water, and internet
- Staff salaries
- Food and kitchen costs
- Repairs and maintenance
- Housekeeping and consumables
- Marketing or broker fees
The most common mistake is leaving costs unassigned. If one expense covers two buildings, split it consistently, for example by number of beds.
Step 2: Calculate the Five Numbers That Decide Profitability
1. Net profit
Net profit = Rent collected − Total expenses
This tells you what each building keeps in rupees. It is useful, but it favours larger properties.
2. Net profit per bed
Net profit per bed = Net profit ÷ Total beds
Divide by total beds, not just occupied beds. This one number reflects pricing, vacancy, collections, and costs together. It is usually the fairest way to rank properties of different sizes.
3. Profit margin
Profit margin = (Net profit ÷ Rent collected) × 100
Margin shows how efficiently a property turns rent into profit. A building with high income but a thin margin is more exposed to a small drop in occupancy.
4. Occupancy rate
Occupancy rate = (Occupied beds ÷ Total beds) × 100
Occupancy explains many profit gaps. Track the monthly average, not only the last day of the month.
5. Collection efficiency
Collection efficiency = (Rent collected ÷ Rent billed) × 100
A property can be full and still weak if tenants pay late or not at all. Pending rent is income you have earned but not received.
Step 3: Rank Your Properties With a Worked Example
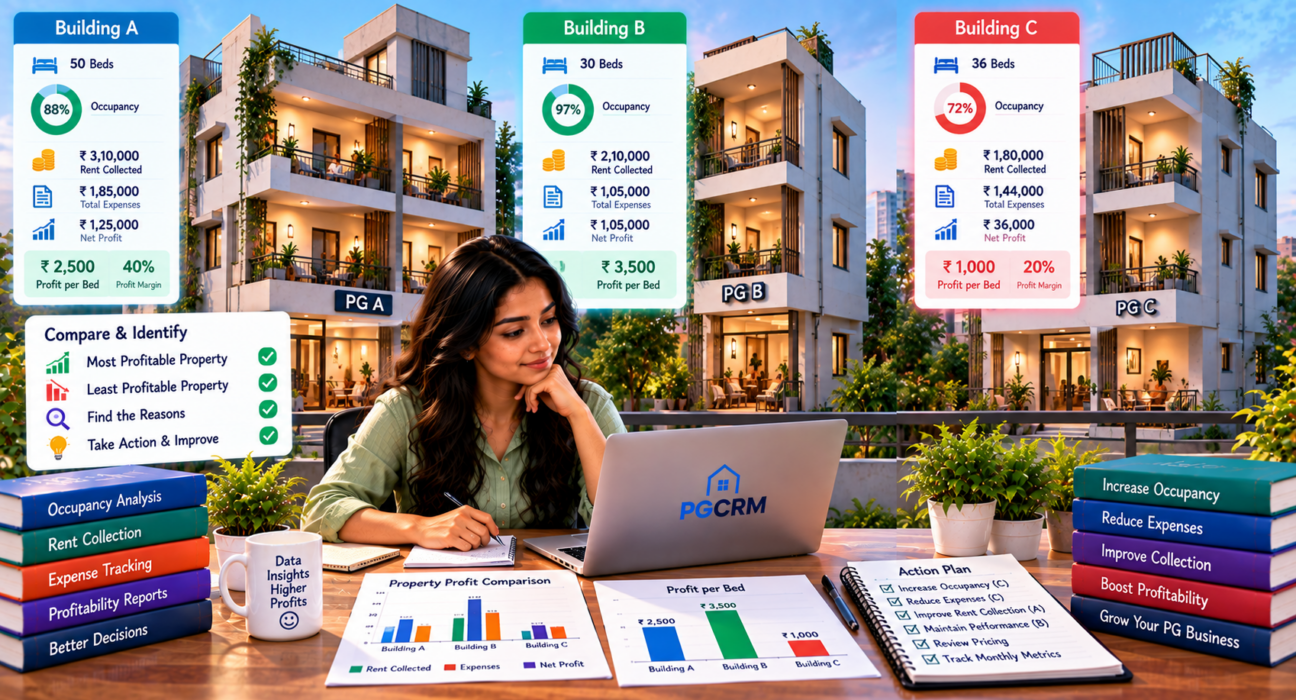
The figures below are illustrative, not real data. Imagine an owner with three buildings.
| Metric | Building A | Building B | Building C |
|---|---|---|---|
| Total beds | 50 | 30 | 36 |
| Occupied beds | 44 | 29 | 26 |
| Occupancy | 88% | ~97% | 72% |
| Rent collected | ₹310,000 | ₹210,000 | ₹180,000 |
| Total expenses | ₹185,000 | ₹105,000 | ₹144,000 |
| Net profit | ₹125,000 | ₹105,000 | ₹36,000 |
| Net profit per bed | ₹2,500 | ₹3,500 | ₹1,000 |
| Profit margin | ~40% | 50% | 20% |
Here is how to read it:
- Building A earns the most in total rupees, but it is not the most profitable per bed.
- Building B is the most profitable. It is the smallest, yet it has the highest per-bed profit and margin.
- Building C is the weakest. It has low occupancy and high costs, so it keeps only 20% of what it collects.
If this owner only looked at total profit, Building A would seem to be the star. Per-bed analysis shows Building B is the better-run business.
Step 4: Find the Reason Behind Each Result
A ranking tells you where to look. It does not tell you what to fix. Work through the causes in this order.
Is it a revenue problem?
- Compare occupancy with your other buildings.
- Check how many days beds stay empty after a tenant leaves.
- Compare average rent per occupied bed with nearby PGs.
- Look at which room types stay vacant longest.
Is it a collection problem?
- Compare rent billed against rent collected.
- Identify tenants who pay late every month.
- Check whether reminders go out before the due date.
Is it a cost problem?
- Put each expense category side by side across buildings.
- Look for one-time repairs that distort a single month.
- Check electricity and water use per occupied bed.
- Review staff cost relative to the number of tenants.
Is it a tenant-experience problem?
- Review the number of complaints and how quickly they are closed.
- Check turnover. Frequent move-outs mean more vacancy days and more admin.
- Ask leaving tenants why they left.
Usually one or two of these explain most of the gap. Fix the biggest one first.
How to Know Your Break-Even Point
Break-even occupancy is the minimum number of filled beds a property needs to cover its expenses.
Break-even beds = Total monthly expenses ÷ Average rent collected per occupied bed
Using Building C from the example:
- Average rent per occupied bed: ₹180,000 ÷ 26 ≈ ₹6,900
- Break-even beds: ₹144,000 ÷ ₹6,900 ≈ 21 beds, or about 58% occupancy
This assumes expenses stay roughly fixed, which is a simplification. Some costs, such as food, rise with occupancy. Still, it gives a useful warning line. If a building’s occupancy drops close to break-even, it needs attention quickly.
What to Do With Your Least Profitable PG
Do not decide to close or sell a property based on one bad month. Follow a sequence instead.
- Confirm the data. Make sure all rent and expenses are recorded correctly for at least three months.
- Find the main cause. Is it vacancy, collections, or costs?
- Set one clear target. For example, “raise occupancy from 72% to 80%” or “cut electricity cost.”
- Act for one to two quarters. Adjust pricing, improve maintenance, or tighten rent follow-up.
- Re-measure. Compare net profit per bed before and after.
- Decide. If the numbers do not improve, consider restructuring, changing the tenant type, renegotiating the lease, or exiting.
What to Do With Your Most Profitable PG
Your best property has lessons for the rest.
- Copy its habits. Note how it handles reminders, complaints, and vacancies.
- Protect it. Keep maintenance and tenant experience strong so occupancy stays high.
- Test carefully. Small rent increases or added facilities may work, but check local demand first.
- Consider growth. A high per-bed profit may justify a similar property nearby, though you should confirm that demand and costs support it.
Common Mistakes When Measuring PG Property Profitability
- Judging by total income. Bigger buildings always earn more in total.
- Counting billed rent as income. Only collected rent counts.
- Ignoring the lease. For rented buildings, lease cost is often the biggest expense.
- Leaving out hidden costs. Owner-paid utilities, small repairs, and staff time add up.
- Using a single month. Seasonal demand can distort results.
- Mixing deposits with earnings. Deposits are usually refundable.
How PG Management Software Supports Profitability Tracking
The hardest part of profitability analysis is not the formulas. It is getting accurate, consistent data from every building each month.
PG management software such as PGCRM can help by keeping buildings, rooms, beds, tenants, rent status, and expenses in one place. According to the PGCRM website, it offers occupancy reports, income and expense reports, expense tracking by category and building, a live pending rent list, and one view across multiple buildings. With those in place, pulling the same figures for every property takes far less effort than rebuilding them from notebooks.
| Task | Registers and spreadsheets | PG management software |
|---|---|---|
| Rent collected vs pending | Manual checking | Live pending list |
| Expenses by building | Often mixed or missing | Recorded by category and building |
| Occupancy across buildings | Counted by hand | Available in occupancy reports |
| Month-end comparison | Hours of work | Faster, from recorded data |
Software will not make a weak property profitable. It shows you which property needs attention and why.
Frequently Asked Questions
How do I know which PG property is most profitable?
Calculate net profit per bed for each property over the same period. Subtract total expenses from rent collected, then divide by total beds. The building with the highest figure is the most profitable relative to its size. Also check profit margin to see how efficiently each building converts rent into profit.
What is a good profit margin for a PG?
There is no single standard, because margins depend on location, lease costs, food services, and pricing. A more useful approach is to compare your own properties with each other over time. Track margin monthly and investigate any building that falls well below your others.
Should I compare total profit or profit per bed?
Use profit per bed for ranking, and look at total profit for overall business impact. Total profit favours larger properties, so it can hide inefficiency. Per-bed profit removes the size advantage and shows which building uses each bed most effectively.
How many months of data do I need?
Use at least three months, and ideally six to twelve. A single month can be distorted by seasonal demand, one-time repairs, or a batch of move-ins and move-outs. Longer periods give a more reliable picture of each property’s real performance.
Why is my PG full but not profitable?
High occupancy does not guarantee profit. Common causes include rents set too low, high lease or utility costs, late or unpaid rent, heavy maintenance spending, and excess staff. Compare collection efficiency and expense categories to find where profit is leaking.
When should I consider closing a PG property?
Only after several months of accurate data does it show it stays below break-even or delivers very low profit per bed despite corrective action. First try fixing occupancy, pricing, collections, or costs. If numbers still do not improve, explore renegotiating the lease or changing the property’s model before exiting.
Can PG software help track profitability across properties?
Yes. Software that stores rent, expenses, and occupancy for every building lets you pull consistent reports. PGCRM, for example, provides income and expense reports, occupancy reports, and a single view across multiple buildings, which helps you compare properties without rebuilding data by hand.
Conclusion
To measure PG property profitability, look beyond rent collected. Subtract every expense, divide by beds, and compare occupancy, collection efficiency, and margin across buildings. Your most profitable property is often not your largest, and your weakest one usually has a specific, fixable cause.
Accurate records make all of this possible. To keep your buildings, tenants, rent, and expenses organised in one place, explore PGCRM to simplify your PG and hostel management.